Why Money Is Leaving the Nasdaq 100 and Moving to the Dow?

The stock market has been extremely volatile recently. Volatility is great for Day and Swing Traders like myself, but can be very stressful for others. Just in the past few days, there has been a noticeable trend of money moving out of the Nasdaq 100 and into the Dow Jones Industrial Average (Dow). This article will hopefully be able to provide you with the reasons behind this transfer of money and give some insight to investors looking to navigate the changing tide.

Before I look at the reasons, let me just explain to the beginning investor the difference between the Nasdaq 100 and the Dow. The Nasdaq 100 is a tech-heavy index comprised of the largest non-financial companies listed on the Nasdaq Stock Exchange. It includes the modern day titans of industry like Apple, Microsoft, Amazon, Alphabet, and Nvidia just to name a few. By looking at the Nasdaq 100, you will get a good barometer for how the entire technology sector is performing in the market on any given particular day or specified timeframe.

The Dow, however, is a price-weighted index of 30 very popular companies, spanning a variety of industries, including technology, healthcare, consumer goods, and financial services. The Dow represents a broader spectrum of the U.S. economy, offering a mix of growth and value stocks along with some big tech names also. Some of the big DOW 30 companies are Coca-Cola, Home Depot, Visa, Nike, and McDonald’s just to name a few!!!

One of the primary reasons for the recent capital shift from the Nasdaq 100 to the Dow is growing concern over the tech sector. Tech stocks have experienced meteoric rises over the past decade, but this rapid growth has also led to high valuations. Investors are becoming wary of these elevated valuations, fearing that they might not be sustainable in the long term.

In my opinion, the recent regulatory scrutiny by our 2 presidential candidates on big tech companies is intensifying. Not only in the US, but governments worldwide seem to be looking more closely at issues such as antitrust violations, data privacy, and market monopolies. This increased scrutiny can potentially lead to new regulations that could impact the profitability and growth prospects of tech giants. Just today, Joe Biden and Donald Trump were talking about tightening policy’s on Chip Making giants like Taiwan Semiconductor, Nvidia, and AMD. These possible upcoming regulations are certainly affecting NASDAQ 100 securities and not impacting the DOW as harshly.

Remember that diversification is a fundamental pillar of sound investing. By reallocating funds from the Nasdaq 100 to the Dow, some investors may be looking to diversify their portfolios. The Dow, has always tended to offer a more balanced approach and can help cushion against sector-specific risks. For more information on invest be sure to follow Investment Mob across social media.

Happy Trading,

Jeff from Investment Mob

Why Meme Stocks, Especially AMC, Are Very Volatile and Risky Investments!!!

The past few years, “Meme Stocks” have captured the attention of investors and the media alike. Meme Stocks, which have fueled by social media hype and online Reddit forums, have seen unprecedented volatility (notice I did not say Gains/Profits). AMC Entertainment Holdings, Inc. (Stock Symbol: AMC) is one of the most prominent examples of a Meme Stock that has seen dramatic price swings, leaving many investors on a rollercoaster ride and holding the bag. While the excitement surrounding Meme Stocks can be tempting, it's important to understand why investing in them, especially AMC, is extremely risky.

What is a Meme Stock?

Meme Stocks are usually defined by their popularity on social media platforms such as Reddit. The thread that popularized Meme Stocks was in the forum r/WallStreetBets. The collective enthusiasm of investors can drive these stocks to sky-high valuations, often disconnected from the companies' actual financial health or business prospects. This phenomenon gained mainstream attention with the GameStop (GME) saga in early 2021 and has continued with other stocks like AMC.

AMC: From Cinema Giant to Meme Stock

AMC was once known as a leading movie theater chain before becoming a focal point for investors who viewed it as a symbol of the struggle between everyday traders and Wall Street. The COVID-19 pandemic hit the AMC movie theater franchise hard, leading to significant financial distress. However, Meme Stock Mania caught the eye of greedy risk taking investors in early 2021 and sent AMC's stock price soaring, despite its financial challenges.

Factors Contributing to AMC's Volatility and Risk

Investing in AMC brings along a ton of volatility and risk due to several factors. First, the stock's price is heavily influenced by social media. Additionally, short squeezes contribute to its unpredictability. The stock also trades at values disconnected from its financial fundamentals, meaning that AMC is driven more by manipulation rather than by the company's actual performance. Finally, emotional investing and FOMO will overshadow rational investors, exacerbating the stock's volatility making it impossible to predict future price movements.

The price of AMC stock is heavily influenced by online discussions and trends. A single viral post or a coordinated buying effort can cause dramatic price movements, making the stock unpredictable and highly volatile. This influence often leads to rapid changes in investor sentiment, further exacerbating price swings.

A significant portion of the volatility in AMC can be attributed to short squeezes. When a large number of shares are shorted, any upward price movement can force short sellers to cover their positions, leading to rapid and significant price spikes. These short squeezes are often temporary and can result in substantial losses when the stock price normalizes, creating a precarious situation for both short sellers and long-term investors.

The value of AMC’s stock often appears disconnected from its financial fundamentals. Despite ongoing financial struggles, including massive debt and uncertain revenue prospects, the stock price can soar based purely on speculative trading rather than the company’s actual performance. This disconnect makes it difficult to gauge the true value of the stock based on traditional financial metrics.

The high volatility and trading volume of AMC stock have raised concerns about potential market manipulation. The SEC and other regulatory bodies have expressed interest in understanding the dynamics behind meme stocks to protect retail investors from potential harm. This scrutiny highlights the risks associated with stocks that can be easily swayed by large-scale coordinated efforts.

Many Meme Stock investors are driven by emotions rather than rational analysis. The desire to be part of a movement or to achieve quick profits can overshadow traditional investment principles, leading to irrational buying and selling behaviors. This emotional investing can create extreme volatility, making it challenging to predict future price movements and increasing the risk of significant losses.

The aforementioned volatility along with the following points all add up to a risky play if you are considering investing in AMC or other Meme Stocks.

AMC has huge price swing in a matter of seconds. The price of AMC can change dramatically within short periods, making it challenging to predict price movement resulting in of significant losses. Along with wide spreads in the Bid/Ask, MEME stocks are not ideal for investing.

Unlike some more stable investments, AMC does not offer dividends, meaning investors cannot rely on a steady income stream while holding onto the stock the for the long term. While the excitement for the fast cash in Meme Stock trading like AMC can be tempting, the risks cannot be ignored!!! Smart money will move past these stocks and understand that their prices are often driven by speculative traders and social media influence rather than fundamentals and technicals.

Happy Trading,

Jeff from Investment Mob

The Good, The Bad, and The Ugly of Trading

Trading in the stock market can feel like riding a roller coaster. It’s thrilling, unpredictable, and downright scary. Whether you’re a seasoned veteran trader or a rookie, trading is sometimes unnerving. Let’s look into the good, the bad, and the ugly of trading, using real-life examples to highlight these aspects.

The Good: Success Stories in Trading

The Amazon Rocket 🚀:

Imagine investing in Amazon back in the late 1990s when it was just an online bookstore. Those who did are likely enjoying the fruits of their foresight today. Amazon’s growth has been nothing short of phenomenal, transforming from a small e-commerce site into a global tech giant. Investors who held on saw massive returns, proving that sometimes, patience and a bit of risk-taking can pay off big time.

Apple’s Resurgence 🍎:

Apple Inc. is another shining example of successful trading. After facing near bankruptcy in the late 1990s, Apple turned its fortunes around with the introduction of groundbreaking products like the iPod, iPhone, and iPad. Investors who believed in Steve Jobs’ vision and held onto Apple stock have seen incredible returns, with the company becoming one of the most valuable in the world.

The Bad: Trading Pitfall

The Snapchat IPO 👻:

Snap Inc., the parent company of Snapchat, went public in 2017 with much fanfare. However, the initial hype soon fizzled. Many investors who bought into the IPO hoping for quick gains were left disappointed as the stock struggled to live up to expectations. This serves as a reminder that not all IPOs are golden tickets and highlights the importance of due diligence.

The Dot-Com Bust 📉:

The late 1990s saw a surge in internet-based companies going public, with sky-high valuations often based on little more than hype. When the bubble burst in 2000, many investors lost significant amounts of money as stock prices plummeted. Companies like Pets.com became infamous examples of overhyped stocks that couldn’t deliver.

The Downright Ugly: Cautionary Tales

Enron’s Collapse 🧨:

Perhaps one of the most notorious examples of the ugly side of trading is the Enron scandal. Once considered a blue-chip stock, Enron’s fraudulent practices led to its bankruptcy in 2001, wiping out billions in shareholder value and pensions. This event underscored the importance of corporate transparency and ethics in the market.

The GameStop Frenzy 🎢:

In early 2021, GameStop became the center of a trading frenzy driven by retail investors on Reddit. While some made significant profits, others who bought in late faced substantial losses. The GameStop saga highlighted the volatility that can come with meme stocks and the risks of speculative trading driven by social media trends.

Lessons Learned

-Successful trading requires research and understanding. Look beyond the hype and analyze the fundamentals of a company before investing. So do your homework.

-Don’t put all your eggs in one basket. Diversifying your portfolio can help mitigate risks and protect your investments.

-The market is constantly changing. Stay updated with the latest news, trends, and insights to make informed decisions.

-Whether you’re a day trader or a long-term investor, having a clear strategy can help you navigate the ups and downs of the market. By learning from past successes and mistakes, you can become a more informed and strategic investor.

Happy Trading,

Jeff from Investment Mob

Investment Mobs Top 24 Stocks Under $24 in 2024

 2024 hopes to show some optimism in the markets as the FED has indicated that inflation is under control and interest rates may be lowered in the upcoming year. Investment Mob has you covered with the highly-anticipated annual 24 Stocks Under $24 in 2024. Discover undervalued gems, market trends, and strategic insights that that only Tom from Investment Mob can provide. Whether you’re a seasoned investor seeking the next big opportunity or a newcomer navigating the complexities of the stock market, this comprehensive guide is your starting point to find undervalued picks. Tom and the Investment Mob team struts into the New Year focused and ready for some more swings in the markets. Here at Investment Mob we hope 2024 finds you well and gives you the gift of Tom’s 24 Stocks Under $24 in 2024.

1. ALX Oncology Holding (AXLO $12.26) is a clinical stage immuno-oncology company which focuses on developing therapies for cancer patients. ALXO has collaboration agreements with Merck; Zymeworks as well as Tallac Therapeutics.

Market Cap: $623 Million Ave Trade Volume: 1,375,000 shares

 2. Couchbase (BASE $20.41) provides a database for enterprise applications which works in multiple configurations to on premise environments to the edge. 

Market Cap: $1 Billion Ave Trade Volume: 2342,000 shares

 3. Cabaletta Bio (CABA @ $16.50) a clinical-stage biotechnology company, focuses on the discovery and development of engineered T cell therapies for patients with B cell-mediated autoimmune diseases. It has a collaboration with the University of Pennsylvania and the Children’s Hospital of Philadelphia. 

Market Cap: $777 Million Ave Trade Volume: 1,138,000 shares

 4. Chewy (CHEW $20.81) engages in the pure play e-commerce business providing pet food, treats, pet supplies,pet medications, and other pet-health products.

Market Cap: $8.5 Billion Ave Trade Volume: 8,070,000 shares

 5. Coupang (CPNG @ $21.80) owns and operates in e-commerce business. The company operates through two segments, Product Commerce and Developing Offerings selling various products and services including (home goods, apparel, beauty products, fresh food and groceries). The company also offers Rocket Fresh, which offers fresh groceries; Coupang Eats, a restaurant ordering and delivery services; and Coupang Play, an online content streaming services.

Market Cap: $28.5 Billion Ave Trade Volume: 7,980,000 shares

 6. Freshworks (FRSH $20.19) provides modern software-as-a-service products. It offers Freshdesk Support Desk and Freshdesk Contact Center.

Market Cap: $6.3 Billion Ave Trade Volume: 2,245,000 shares

 7. Fastly (FSLY $17.26) operates an edge cloud platform for processing, serving, and securing its customer’s applications. The edge cloud is a category of Infrastructure as a Service that enables developers to build, secure, and deliver digital experiences at the edge of the internet.

Market Cap: $2.25 Billion Ave Trade Volume: 2,700,000 shares

 8. The Good Year Tire & Rubber Company (GT $13.97) develops, manufactures, distributes, and sells tires and services worldwide under the Goodyear, Cooper, Dunlop, as well as private-label brands.

Market Cap: $4 Billion Ave Trade Volume: 3,500,000 shares.

 9. Robinhood Markets (HOOD $11.73) operates financial services platform to invest in stocks, exchange-traded funds (ETFs), options, gold, and cryptocurrencies. 

Market Cap: $10.0 Billion Ave Trade Volume: 9,600,000 shares

 10. i3 Vertical (IIIV $19.77) provides integrated payment and software solutions primarily to the public sector and healthcare markets. It operates in two segments, Software and Services, and Merchant Services.

Market Cap: $658 Million Ave Trade Volume: 151,000 shares

 11. Invesco (IVZ $15.23) is a publicly owned investment manager. The firm provides its services to retail clients, high-net worth clients, public entities, corporations, unions, pension funds, and financial institutions.

Market Cap: $7 Billion Ave Trade Volume: 5,470,000 shares

 12. IonQ,Inc (IONQ $13.69) engages in the development of general-purpose quantum computing systems in the United States. It sells access to quantum computers of various qubit capacities.

Market Cap: $2.6 Billion Ave Trade Volume: 9,800,000 shares

 13. Nintendo (NTDOY $11.78) develops, manufactures, and sells home entertainment products. Also offers video game platforms, playing cards, and handheld and home console hardware systems.

Market Cap: $55 Billion Ave Trade Volume: 881,000 shares

 14. Opera Limited (OPRA $11.19) provides mobile and PC web browsers. Operates in two segments, Browser and News, and Other.

Market Cap: $970 Million Ave Trade Volume: 784,000 shares

 15. PubMatic (PUBM $17.11)  provides a cloud infrastructure platform that enables real-time programmatic advertising transactions for Internet content creators and advertisers.

Market Cap: $868 Million Ave Trade Volume: 339,000 shares

 16. SentinelOne (S $24.00) operates as a cybersecurity provider in the United States and internationally. 

Market Cap: $7.6 Billion Ave Trade Volume: 5,600,000 shares

 17. Schneider National (SNDR $23.84) engages in the provision of surface transportation & logistics solutions in the United States, Canada & Mexico. Company operates through 3 segments: Truckload, Intermodal, & Logistics.

Market Cap: $4.2 Billion Ave Trade Volume: 596,000 shares

 18. Sonos (SONO $16.05) designs, develops, manufactures, and sells audio products and services worldwide.

Market Cap: $2 Billion Ave Trade Volume: 2,300,000 shares

 19. Syndax Pharmeceuticals (SNDX $16.65) a clinical-stage biopharmaceutical company, develops therapies for the treatment of cancer.

Market Cap: $1.2 Billion Ave Trade Volume: 1,950,000 shares

 20. Teladoc Health (TDOC $19.21)  provides virtual healthcare services in the United States and internationally.

Market Cap: $3.16 Billion Ave Trade Volume: 5,000,000 shares

 21. Toast (TOST $15.31) operates a cloud-based and digital technology platform for the restaurant industry. Toast offers Point of Sale (POS), a hardware product; Toast Order & Pay, which allows guests to order and pay from their mobile devices and Toast Go, a handheld POS device that enhances the table turn times.

Market Cap: $8.32 Billion Ave Trade Volume: 8,6800,000 shares

 22. V.F. Corp (VFC $18.14) provides branded lifestyle apparel under The North Face, Timberland, Smartwool, Icebreaker, Altra, Vans, Supreme, Kipling, Napapijri, Eastpak, JanSport, Dickies, and Timberland.

Market Cap: $6.9 Billion Ave Trade Volume: 9,052.000 shares

 23. Weave Communications (WEAV $10.06) provides a customer communications and engagement software platform in the United States and Canada. Its platform enables small and medium-sized businesses to maximize the value of their customers.

Market Cap: $746 Million Ave Trade Volume 309,000 shares

 24. Clear Secure (YOU $21.78) operates a secure identity platform under the CLEAR brand name primarily in the United States. Its secure identity platform is a multi-layered infrastructure consisting of front-end, including enrollment, verification, and linking. Also offers CLEAR Plus, a consumer aviation subscription service.

Market Cap: $3.45 Billion Ave Trade Volume: 1,200,000 shares

Smart Strategies for Investing in the Stock Market on a Budget

Navigating the stock market on a budget may seem scary, but fear not as I will show you the investmentmob.com approach to building wealth even with a Happy Meal budget. Here's a guide to help you get started without breaking the bank.

First we can look at the relatively new concept of buying fractional shares. Investing in fractional shares allows you to buy a portion of high-priced stocks, enabling diversification without a substantial initial investment. You can purchase factional shares on online and app based platforms like Robinhood and Charles Schwab. These companies have been offering this feature for a few years and it is popular amongst beginner traders. Buying fractional shares allow you to invest in high priced blue chip companies like Amazon, Google, Apple, Tesla, etc with as little as a few dollars!

Another strategy is leveraging spare change. Apps like Acorns and Stash round up your everyday purchases to the nearest dollar and invest the spare change into a diversified portfolio. While individually small, these contributions can accumulate into a significant investment over time, leveraging your daily spending into potential financial growth. After you have saved up a few dollars rounding up, I would recommend taking that money, transferring it to your brokerage, and buying shares or fractional shares in a company you want to hold for the long term.

While I always tell people to run the other way when someone tries to pitch them a penny stock, when just starting out, you may want to own a few round lots(100 shares) in a position. Penny stocks can be an option for investors with limited funds. These low-priced stocks can offer substantial returns if chosen wisely, although they come with much higher risks than blue chips. Thorough research and understanding of the market are essential when delving into penny stocks, as their value can be highly volatile.

By focusing on these strategies and staying informed, you can make prudent financial choices and gradually build a substantial portfolio, setting the stage for long-term financial success. Remember, patience and knowledge are your best allies in the world of investing.

Happy Trading,

Jeff from Investmentmob.com

The beginners Gameplan to Navigating the Stock Market!

Throw Yourself into the Street

Embrace the wonderful world of finance. Learn the lingo, understand the market trends, and don’t be shy to ask questions. You should start looking for companies with solid fundamentals and a real business behind them. Avoid those sketchy “get-rich-quick” schemes peddled by that “friend” who always seems to lose his/her wallet when the lunch bill comes.

Pick the Perfect Partner (AKA the Broker)

Find a broker that feels like a match made in Wall Street heaven. Check out their fees, user-friendliness, and customer service. You want someone who’ll treat you right, not ghost you after you sign up for their service. Don’t rush into things; take your time, do some comparison shopping, and choose the one who won’t break your heart—or your bank account.

Be Cautious with Margin

Margin can be a game-changer! It can make things more exciting but also riskier. Know when to sprinkle it in and when to hold back. Make sure you read the fine print carefully. Understand the interest rates and potential consequences before you dive in headfirst.

Learn Technical Analysis

Technical analysis involves analyzing charts, patterns, and trends. It’s like trying to crack the stock market’s code. Get comfortable with MACD, RSI, candlestick charts, moving averages, and other technical analysis tools. You can find resources on how to use these in my previous blogs.

Enjoy the Ride! Celebrate Wins and Learn from Losses!

The stock market is a roller coaster ride, so fasten your seatbelt and get ready for the ups, downs, and occasional loop-de-loops. Stay calm when the market gets bumpy. Stick to your game plan and remember that every ride has an slow ending. Remember that when you pick a winner, give yourself a pat on the back. Celebrate your success, like savvy Wall Street investor. But keep in mind that when you take a loss on a trade, don’t let it ruin your day. Learn from the losses, even pros make mistakes. It’s all part of the adventure.

Happy Trading,

Jeff from Investment Mob

Let’s Talk RSI

The Relative Strength Index (RSI) is a popular technical indicator used by traders to identify potential trading opportunities in the stock market. The RSI is a momentum oscillator that measures the speed and change of price movements. It is calculated by taking the average of the gains and losses over a specified period of time. The RSI is a widely used tool for analyzing the strength of a stock's price movements and can be used to identify overbought and oversold conditions.

The RSI is calculated by taking the average of the gains and losses over a specified period of time. The RSI is then plotted on a scale of 0 to 100. A reading of 70 or above indicates that a stock is overbought, while a reading of 30 or below indicates that a stock is oversold. Traders use the RSI to identify potential trading opportunities when the stock is overbought or oversold.

The RSI can also be used to identify divergences between the price of a stock and the RSI. A bullish divergence occurs when the price of a stock is making lower lows, while the RSI is making higher lows. This indicates that the stock may be ready to reverse its downward trend. A bearish divergence occurs when the price of a stock is making higher highs, while the RSI is making lower highs. This indicates that the stock may be ready to reverse its upward trend.

Traders can also use the RSI to identify potential support and resistance levels. When the RSI is above 70, it indicates that the stock is overbought and may be ready to pull back. When the RSI is below 30, it indicates that the stock is oversold and may be ready to rally.

The RSI is a powerful tool for traders to identify potential trading opportunities in the stock market. By using the RSI to identify overbought and oversold conditions, divergences, and support and resistance levels, traders can gain an edge in the stock market.

How to use the MACD indicator to trade stocks in 2023

For those who are unfamiliar with technical analysis, MACD is a good first introduction to the discipline. I can surely vouch that in my early days working on Wall Street, all the traders in my brokerage house would use this as their first tool to determine if a stock was setting up to be a good trade or not. The MACD (Moving Average Convergence Divergence) is a technical analysis indicator that is used to identify trend changes in the price of a security. It is calculated by subtracting the 26-day exponential moving average (EMA) from the 12-day EMA. A nine-day EMA of the MACD, called the "signal line," is then plotted on top of the MACD, and is used to identify buy and sell signals when the lines cross each other.

In its simplest form, to use MACD signals to trade stocks, you can use the following steps:

  1. First, plot the MACD and signal line on your chart. Each online brokerage has the different charting systems and ways to do this, so don’t be shy to call up your brokerage firm and ask them for help setting this chart up.

  2. Look for the MACD line to cross above the signal line, which is a bullish signal. This indicates that the price of the security is likely to rise according to the MACD indicator.

  3. Consider buying the stock when the MACD line crosses above the signal line.

  4. You can also search for the MACD line to cross below the signal line, which is a bearish signal. This indicates that the price of the security is likely to fall.

  5. Consider selling the stock when the MACD line crosses below the signal line.

Keep in mind that the MACD is just one technical indicator that you can use to analyze the markets. It could be used in conjunction with other of technical analysis like the Slow Stochastic and RSI indicators which will be discussed in upcoming articles and videos. From a the persective of someone who has been trading for over 25 year, it is important to state that there is not a single indicator out there that works everytime. Most Daytraders and Swingtraders like myself, use a variety of technical analysis indicators to make informed trading decisions.

Happy Trading Everyone,

Jeff from InvestmentMob

Follow our Instagram, Twitter, and YouTube Channel @INVESTMENTMOB.

Investment Mob LLC is not a registered broker-dealer or a registered investment adviser. Any product from Investment Mob LLC is furnished for your personal, noncommercial, informational purpose only, and a particular security in the product does not constitute a recommendation to buy, sell, or hold that or any other security, or that any particular security, portfolio of securities, transaction or investment strategy is suitable for any specific person. You further understand that Investment Mob LLC will not advise you personally concerning the nature, potential, value or suitability of any particular security, portfolio of securities, transaction, investment strategy or other matter. To the extent any of the information contained in the product may be deemed to be investment advice, such information is impersonal and not tailored to the investment needs of any specific person. You acknowledge that you are responsible for your own financial decisions. 

23 Stocks under $23 for the Year 2023

The market was disappointing to say the least in the 2022 calendar year. For the first time in the history of Investment Mob, we took a loss on our yearly stock picks. 2023 hopes to show some optimism in the markets even though the FED remains steadfast on raising interest rates and a looming recession seems emanate. Tom and team comes into the New Year focused and ready for some more swings in the market which can result in Investment Mob coming back to the black. Here at Investment Mob we hope 2023 finds you well and give you the gift of Tom’s 23 Stocks under $23 dollars for the year 2023.

1. Adyen N.V. (ADYEY $14.09) operates a global financial technology payment platform, risk management, infrastructure for authorizing payments and settlement services connecting them directly to Visa, Mastercard and other providers.

Market Cap: $44 Billion Ave Trade Volume: 926,000 shares

2. Aehr Test Systems (AEHR $22.59) provides test systems for burning-in semiconductor devices in wafer level, singulated die, and package part form.

Market Cap: $621 Million Ave Trade Volume: 1,000,000 shares

3. Asana (ASAN $14.00) operates a work management platform for individuals and teams. Asana enables teams to share daily tasks, strategic initiatives; and organization wide goal settings.

Market Cap: $2.9 Billion Ave Trade Volume: 3,400,000 shares

4. The AZEK Company (AZEK @ $20.81) engages in designing, manufacturing, and selling of building products for residential, commercial, and industrial markets. Offers bathroom and storage solutions under the Aria, Eclipse, Hiny Hiders, TuffTec, and Duralife to schools, stadium arenas, industrial plants, and commercial facilities.

Market Cap: $3.1 Billion Ave Trade Volume: 2,600,000 shares

5. Bloom Energy (BE $20.81) designs, manufactures, and installs fuel cell systems for on-site power generation. Bloom Energy Server converts fuel, into electricity through a process.  Bloom Energy serves data centers, hospitals, healthcare manufacturing facilities and more.  

Market Cap: $4.0 Billion Ave Trade Volume: 2,600,000 shares

6. Confluent (CFLT @ $21.80) operates a data streaming platform. It offers Confluent Cloud, a managed cloud-native service for connecting and processing data; and Confluent Platform software that connects and processes data in real-time.

Market Cap: $6.2 Billion Ave Trade Volume: 2,700,000 shares

7. Energy Transfer, LP (ET $11.61) provides energy-related services operating pipelines for refined products, natural gas, natural gas liquids, and crude oil. Currently yields 8.9%.

Market Cap: $35.7 Billion Ave Trade Volume: 18,100,000 shares

8. Fastly (FSLY $8.55) operates an edge cloud platform for processing, serving, and securing its customers applications. The edge cloud is a category of Infrastructure as a Service that enables developers to build, secure, and deliver digital experiences at the edge of the internet.

Market Cap: $1.0 Billion Ave Trade Volume: 3,150,000 shares

9. Global-e Online (GLBE $20.13) provides a platform which enables international shoppers to buy online and merchants to sell worldwide.

Market Cap: $3.1 Billion Ave Trade Volume: 1,300,000 shares

10. Kimco Realty Corporation (KIM $20.98) owns interests in 400 U.S. shopping centers and mixed-use assets comprising 70 million square feet of gross leasable space in the top major metropolitan markets. Yields 4.39%.

Market Cap: $13.0 Billion Ave Trade Volume: 4,850,000 shares

11. Fluence Energy (FLNC $19.42) offers energy storage products and services, and artificial intelligence enabled digital applications for renewables and storage applications. Fluence Energy storage products include: Gridstack, Ultrastack, Sunstack and Edgestack.

Market Cap: $2.25 Billion Ave Trade Volume: 874,000 shares

12. Nio (NIO $11.06) designs, develops, manufactures, and sells smart electric vehicles in China.

Market Cap: $19.0 Billion Ave Trade Volume: 61,500,000 shares

13. Samsara (IOT $12.36) provides solutions that connect physical operations data to its Connected Operations Cloud. Serves industries, including transportation and logistics, construction, field services, utilities and energy, government, healthcare and education. 

Market Cap: $6.4 Billion Ave Trade Volume: 1,400,000 shares

14. SentinelOne (S $13.17) operates as a cybersecurity provider in the United States and internationally. 

Market Cap: $3.7 Billion Ave Trade Volume: 3,840,000 shares

15. Schrodinger (SDGR $19.89) provides physics-based software platform that enables discovery of novel molecules for drug development and materials applications.

Market Cap: $1.35 Billion Ave Trade Volume: 602,000 shares

16. Spirit Airlines (SAVE $19.26) provides airline services to 85 destinations in 16 countries in the United States, Latin America, and the Caribbean.

Market Cap: $2.0 Billion Ave Trade Volume: 1,100,000 shares

17. Starwood Property Trust (STWD $18.92) operates as a real estate investment trust (REIT) in the US, Europe, and Australia. Starwood distributes at least 90% of its taxable income to stockholders. Yield 10.15%

Market Cap: $6 Billion Ave Trade Volume: 2,900,000 shares

18. StoneCo (STNE $9.30) operates a cloud-based open application programming interface platform that delivers transaction processing services to clients.

Market Cap: $2.9 Billion Ave Trade Volume: 6,475,000 shares

19. SunPower (SPWR $20.37) a solar technology and energy services provider, offers solar, storage, and home energy solutions to customers primarily in the United States and Canada.

Market Cap: $2.17 Billion Ave Trade Volume: 2,000,000 shares

20. Sweetgreen (SG $9.51) develops and operates fast-casual restaurants serving healthy foods prepared from seasonal and organic ingredients Sweetgreen’s owns and operates 140 restaurants.

Market Cap: $1.0 Billion Ave Trade Volume: 1,900,000 shares

21. Toast (TOST $17.77) operates a cloud-based and digital technology platform for the restaurant industry. Toast offers Point of Sale (POS), a hardware product; Toast Order & Pay, which allows guests to order and pay from their mobile devices and Toast Go, a handheld POS device that enhances the table turn times.

Market Cap: $9.25 Billion Ave Trade Volume: 5,900,000 shares

22. Wendy’s (WEN $22.80) operates, develops, and franchises quick-service restaurants specializing in hamburger sandwiches. Wendy’s operates approximately 403 company-operated restaurants; 5,535 franchised restaurants in the United States; and 1,006 franchised restaurants internationally. 

Market Cap: $4.9 Billion Ave Trade Volume: 2,000,000 shares

23. ZIM Integrated Shipping Services (ZIM $16.29) provides door-to-door and port-to-port transportation services for end-users, consolidators, and freight forwarders. Operates a fleet of 118 vessels (110 container vessels and 8 vehicle transport vessels) as well as 114 chartered-in vessels and network of 70 weekly lines.

Market Cap: $1.95 Billion Ave Trade Volume: 4,500,000 shares

24. Amplitude (AMPL $12.20) provides a digital optimization system to analyze customer behavior within digital products. Amplitude offers a suite of products including: Amplitude Analytics, Amplitude Recommend and Amplitude Experiment.

Market Cap: $1.4 Billion Ave Trade Volume: 488,000 shares

25. Vuzix (VUZI $3.91) develops and provides a cloud-based unified customer experience management platform for enterprises worldwide. Sprinklr enables organizations to do marketing, advertising, research, care, sales, and engagement across channels, including social, messaging, chat, and text.

Market Cap: $268 Million Ave Trade Volume: 698,000 shares

Disclosure: Tom currently own shares of ALL the previously listed securities as speculative investments in his portfolio. These stock picks are in no way, shape, or form intended to be financial advice. They are just investment ideas that encourage the reader to do further research on his or her own. Tom receives no financial compensation for this article. Furthermore, Investment Mob LLC is not a registered broker-dealer or a registered investment adviser. Any product from Investment Mob LLC is furnished for your personal, noncommercial, informational purpose only, and a particular security in the product does not constitute a recommendation to buy, sell, or hold that or any other security, or that any particular security, portfolio of securities, transaction or investment strategy is suitable for any specific person. You further understand that Investment Mob LLC will not advise you personally concerning the nature, potential, value or suitability of any particular security, portfolio of securities, transaction, investment strategy or other matter. To the extent any of the information contained in the product may be deemed to be investment advice, such information is impersonal and not tailored to the investment needs of any specific person. You acknowledge that you are responsible for your own financial decisions. I own shares of Energy Transfer (ET), Fastly (FSLY), Nio (NIO), and SentinelOne (S). I have no plans to initiate any such positions within the next 48 hours. I wrote this article myself, and it expresses my own opinions and investors wishing to purchase shares of any of the above listed stocks should do their own due diligence. I am not receiving compensation nor do I have any business relationships with any companies mentioned in this article. 

22 Stocks under $22 for 2022

2021 proved to be a tough year to navigate the market. We saw historic gains in the Dow and S&P 500 only to give back towards the end of the year thanks to a new holiday gift from our old friend Covid-19. While the omicron strain has allowed the Market to fizzle out

Read More

Coinbase IPO ... A Unicorn's Dream???

cb.jpg

The Coinbase IPO is coming in the next few weeks.  While no official IPO date has been set, the stock appears to be primed to take Wall Street by storm in early March.  With interest peaking in companies like Beyond Meat (BYND), Uber (UBER), Draftkings (DKNG), and Grubhub(GRUB); Coinbase is the kind of company Unicorn dreams are made of. With it’s fast growth stratagy, large capital reserve, and potential to buyout other companies, Coinbase, has the potential to be the biggest Unicorn in Fantasyland. This stock has all the makings of a baby blue chip. While insiders are jumping all over a secondary offering price of around $300 a share, I expect this company to hit the market on IPO day at around $350. 

For those new to the cryptocurrency world, Coinbase is a digital currency exchange headquartered in San Francisco, California, United States. They broker exchanges of all the notable cryptocurrencies like BitcoinBitcoin CashEthereumEthereum ClassicLitecoin and many many more.  Coinbase serves about 32 countries, has over 13,000,000 users, and generates about 1 billion dollars in revenue per.

So this leads us to our next question.  Will Jeff from InvestmentMob.com be buying Coinbase when it starts trading publicly? The short answer is…YES!!! While I ordinarily like to pick and choose my entrance points in stocks, in my opinion, Coinbase has the potential to be the strongest IPO in recent history.  I will be buying on the IPO Date, and then strategically making a few more buys at later dates as to scale into the position.  Remember, it is always important to keep your cool and not get caught up chasing a position.    

Happy Trading,

Jeff from InvestmentMob

The Great Outdoors, 2021 Style

The New Normal isn’t really as new as one may believe it is. In reality, the more things change, the more they stay the same…...thus giving us another opportunity to share childhood pleasures where we would bike, hike, boat, float and play in the great outdoors…..

Read More

Technical Analysis - The Slow Stochastic Oscillator

slow stocastic

My go-to technical analysis tool is without a doubt, the Slow Stochastic indicator.  The Slow Stochastic Oscillator is a form of momentum analysis used in the technical analysis of securities. Its range is between 0 and 100. Since it is a range-bound indicator, it traditionally shows overbought and oversold signals.  Developed by Dr. George Lane, a securities trader and technical analyst, it applies support and resistance levels to forecast turning points in the price of a security by comparing its closing price to its price range over a specific period of time, typically 14 days. Adjusting the period of time on the Slow Stochastic indicator will change the sensitivity of the charts results. This difference in sensitivity gives rise to the two most popular types of Stochastic charting: Fast and Slow Stochastic Oscillators.

The Slow Stochastic indicator helps to identify how daily closing prices tend to accumulate near the lows of the range during periods of fall in price. Conversely, it also determines how daily closing prices tend to lay near the highs of the range in periods of increase in price. It does so by highlighting the position of the closing price over a high-low range during the specific time. Although less sensitive to changes in price than the Fast Stochastic Oscillator; the Slow Stochastic Oscillator processes more input before it generates a signal. Its chances of producing a false signal are thereby reduced.

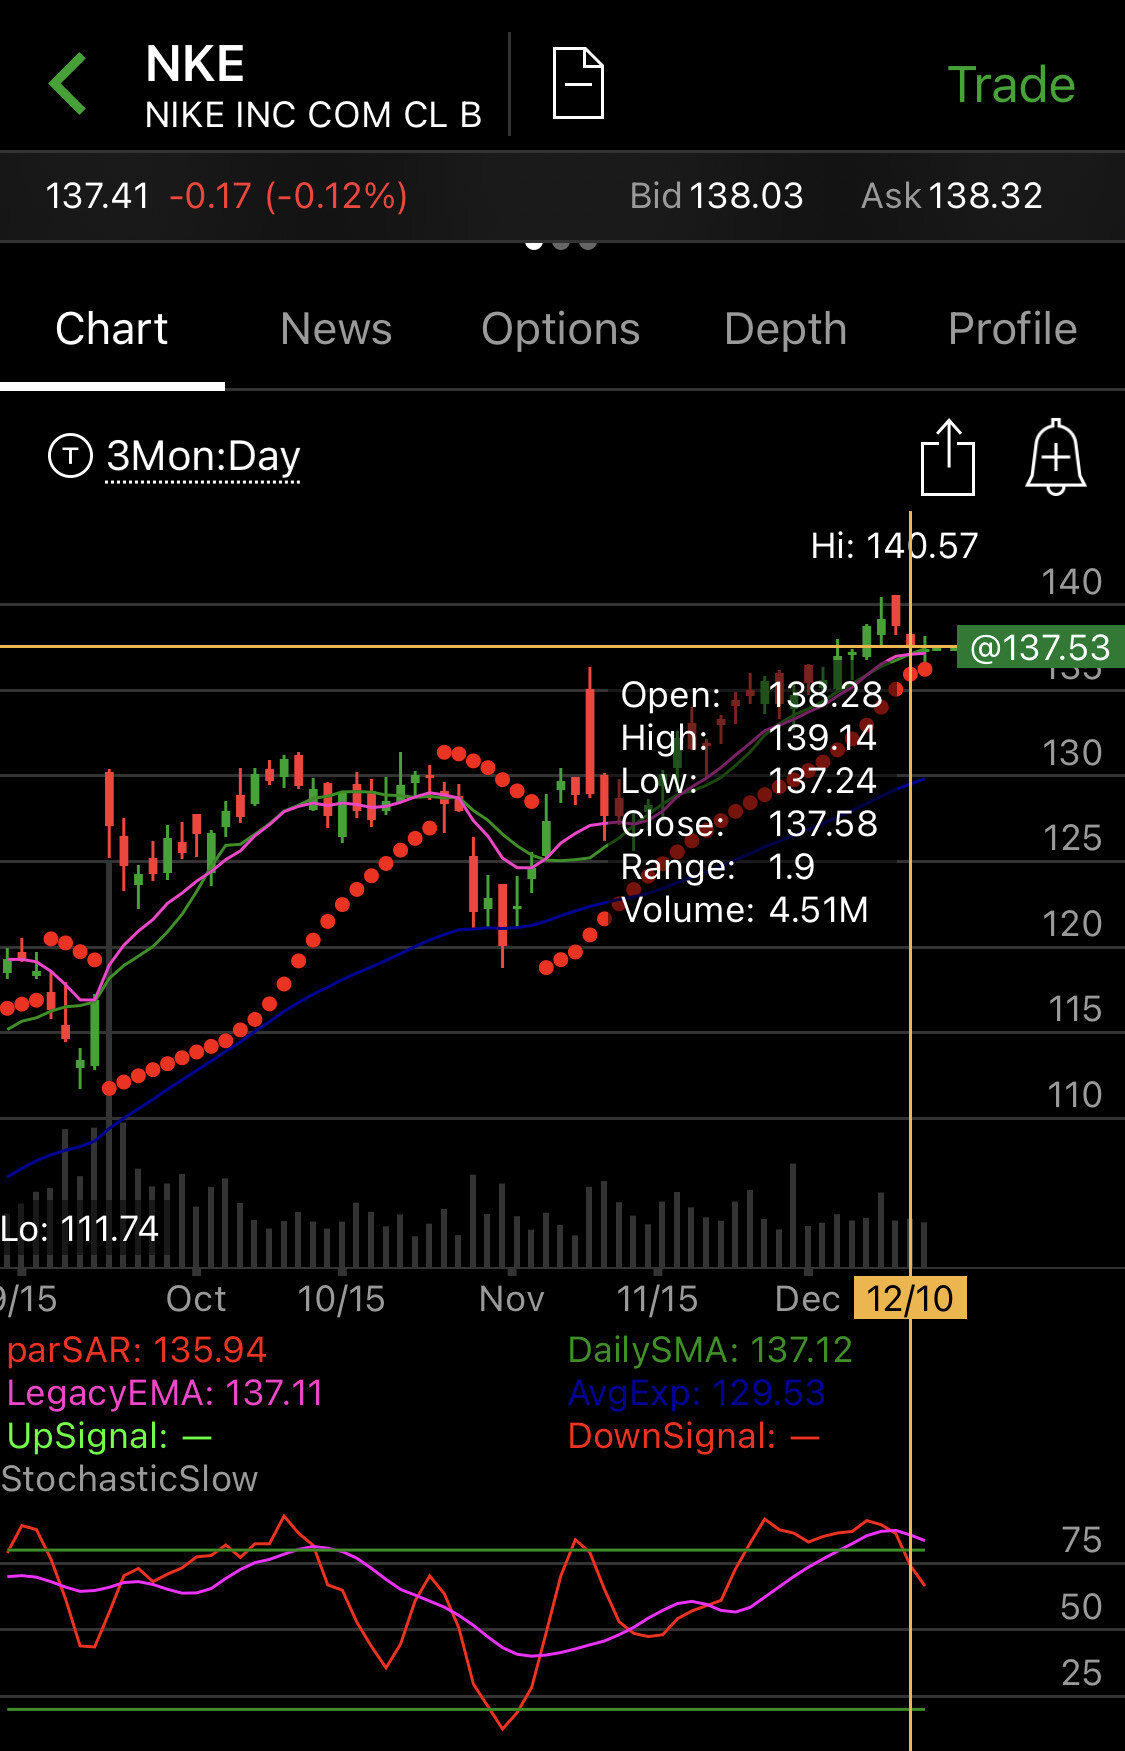
So, how does the Slow Stochastic indicator work?  The area above 80 is generally considered the overbought region while that below 20 is regarded as the oversold region. Hence, the indicator signals a sell when it is above 80 and then crosses back below it.  This particular example can be seen in the screenshot below. The top of the chart is the daily stock price of Nike stock (NKE) for the past 3 months, while the bottom of the screenshot is the Slow Stochastic indicator. As the example shows, Nike stock (NKE) can be seen crossing below the 80 line on December 10th, 2020, signaling a sell (Lets watch this over the next few days and see how this plays out).  Personally, I use a 3 month chart when swing trading.  Feel free to adjust the charts timeframe for your preferred trading strategy.   Also note, a buy signal is given when it is below 20 and then crosses above it. In this instance, 80 and 20 serve like the support and resistance respectively.

NKE.jpg

The Slow Stochastic Oscillator also uses two lines for triggering its signals: the %K line and the %D line. Signals are produced when they cross each other in either the overbought or the oversold region. In the overbought region, a sell signal is triggered when a decreasing %K line goes below the %D line. It is when an increasing %K line crosses above the %D line that a buy signal is generated in the oversold region. However, divergences, which are alerts of potential trend reversals, are formed when the Stochastic does not move in-line with price. When for instance the price makes a lower low, but the Slow Stochastic makes a higher low, a bullish divergence is formed. On the other hand, a bearish divergence occurs when the Slow Stochastic forms a lower high as the price makes a higher high.

The Slow Stochastic Oscillator can be calculated using the formula:

Slow %K = 100[sum of the (C - L14) for the %K Slowing Period / Sum of the (H14 - L14) for the %K Slowing Period]

Slow %D = SMA (Simple Moving Average) of Slow %K

In the formula, C is the most recent closing price, L14 is the lowest low for the past 14 periods, and H14 is the highest high for the same periods.


Happy Trading,

Jeff