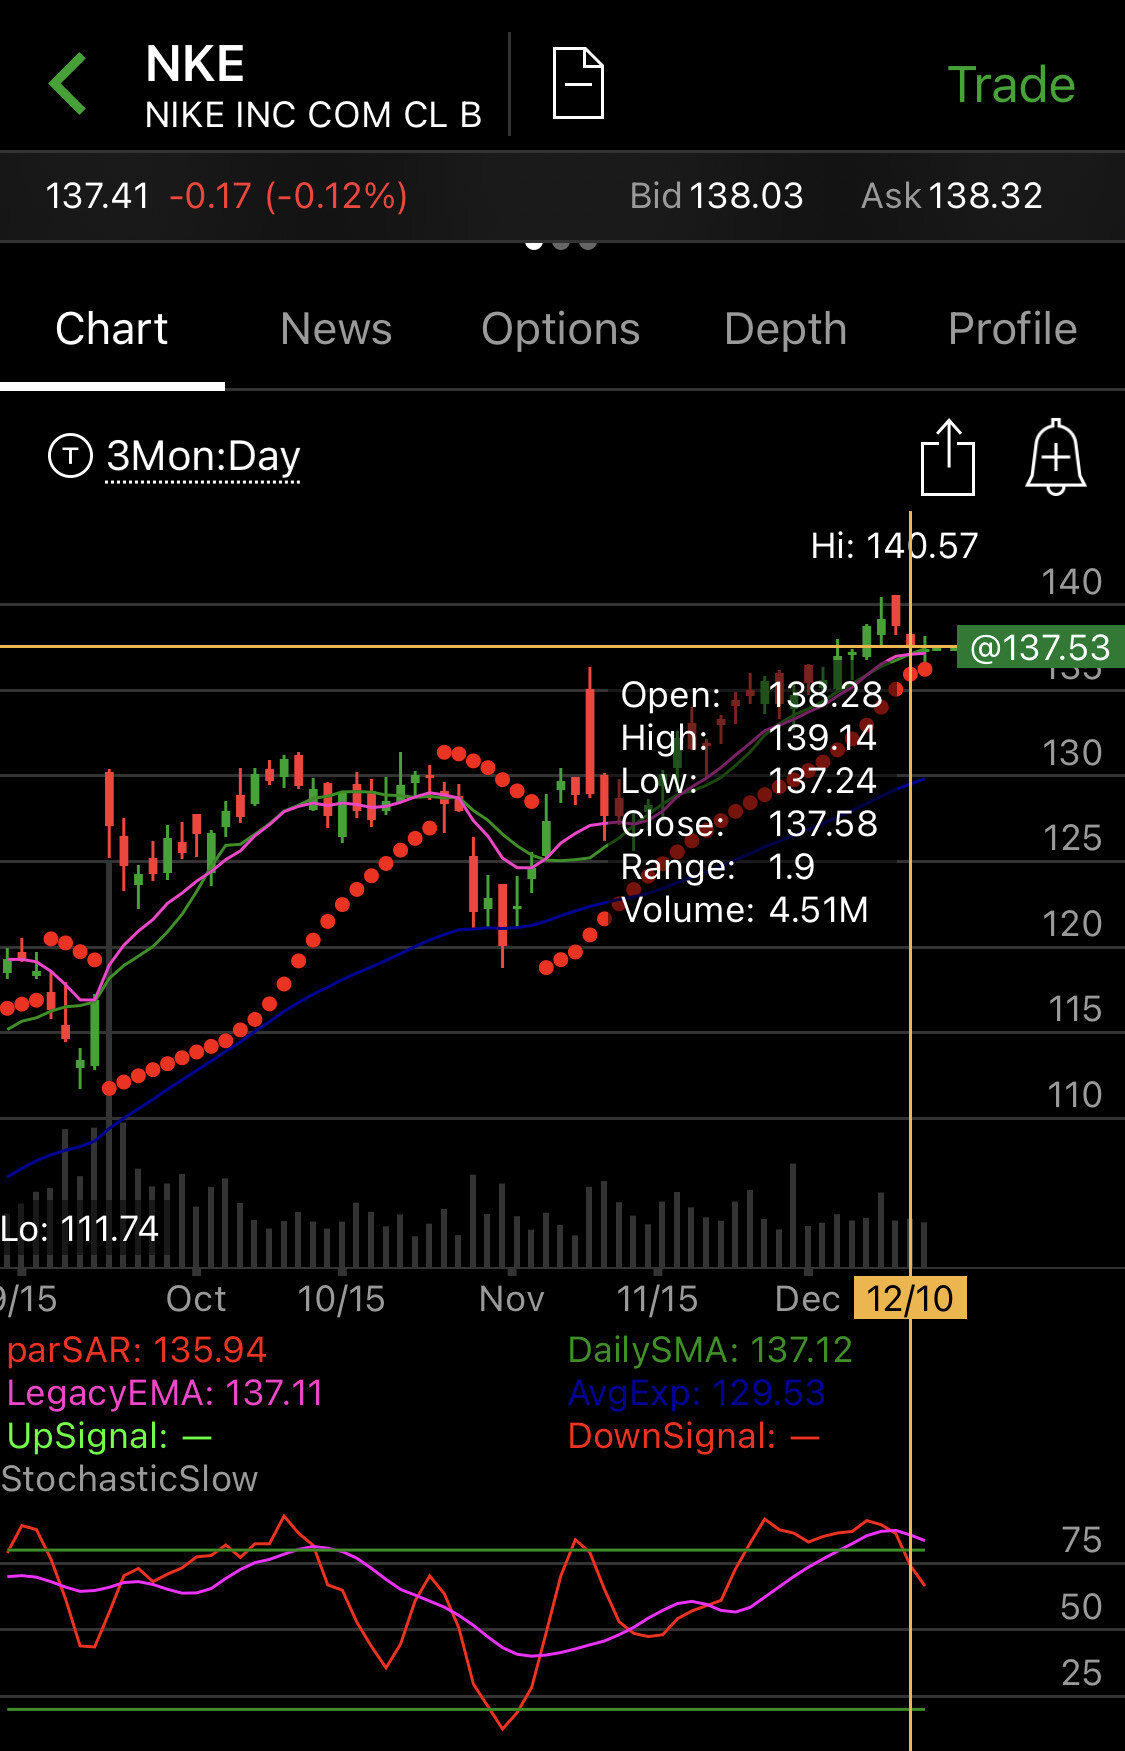
How to use the MACD indicator to trade stocks in 2023
For those who are unfamiliar with technical analysis, MACD is a good first introduction to the discipline. I can surely vouch that in my early days working on Wall Street, all the traders in my brokerage house would use this as their first tool to determine if a stock was setting up to be a good trade or not. The MACD (Moving Average Convergence Divergence) is a technical analysis indicator that is used to identify trend changes in the price of a security. It is calculated by subtracting the 26-day exponential moving average (EMA) from the 12-day EMA. A nine-day EMA of the MACD, called the "signal line," is then plotted on top of the MACD, and is used to identify buy and sell signals when the lines cross each other.
In its simplest form, to use MACD signals to trade stocks, you can use the following steps:
First, plot the MACD and signal line on your chart. Each online brokerage has the different charting systems and ways to do this, so don’t be shy to call up your brokerage firm and ask them for help setting this chart up.
Look for the MACD line to cross above the signal line, which is a bullish signal. This indicates that the price of the security is likely to rise according to the MACD indicator.
Consider buying the stock when the MACD line crosses above the signal line.
You can also search for the MACD line to cross below the signal line, which is a bearish signal. This indicates that the price of the security is likely to fall.
Consider selling the stock when the MACD line crosses below the signal line.
Keep in mind that the MACD is just one technical indicator that you can use to analyze the markets. It could be used in conjunction with other of technical analysis like the Slow Stochastic and RSI indicators which will be discussed in upcoming articles and videos. From a the persective of someone who has been trading for over 25 year, it is important to state that there is not a single indicator out there that works everytime. Most Daytraders and Swingtraders like myself, use a variety of technical analysis indicators to make informed trading decisions.
Happy Trading Everyone,
Jeff from InvestmentMob
Follow our Instagram, Twitter, and YouTube Channel @INVESTMENTMOB.
Investment Mob LLC is not a registered broker-dealer or a registered investment adviser. Any product from Investment Mob LLC is furnished for your personal, noncommercial, informational purpose only, and a particular security in the product does not constitute a recommendation to buy, sell, or hold that or any other security, or that any particular security, portfolio of securities, transaction or investment strategy is suitable for any specific person. You further understand that Investment Mob LLC will not advise you personally concerning the nature, potential, value or suitability of any particular security, portfolio of securities, transaction, investment strategy or other matter. To the extent any of the information contained in the product may be deemed to be investment advice, such information is impersonal and not tailored to the investment needs of any specific person. You acknowledge that you are responsible for your own financial decisions. 


